
Unlocking Growth through National Scale and Local Relevance
Out of Home has never been more powerful in New Zealand, and the greatest opportunity lies in planning at a national scale. The oOh! Advantage combines that scale with local connection – a smarter way to unlock stronger brand growth.
Think National
New Zealand’s biggest untapped audience opportunity lies beyond single-city planning. NZ audiences and buying decisions are nationwide, and OOH planning is shifting to reflect that.
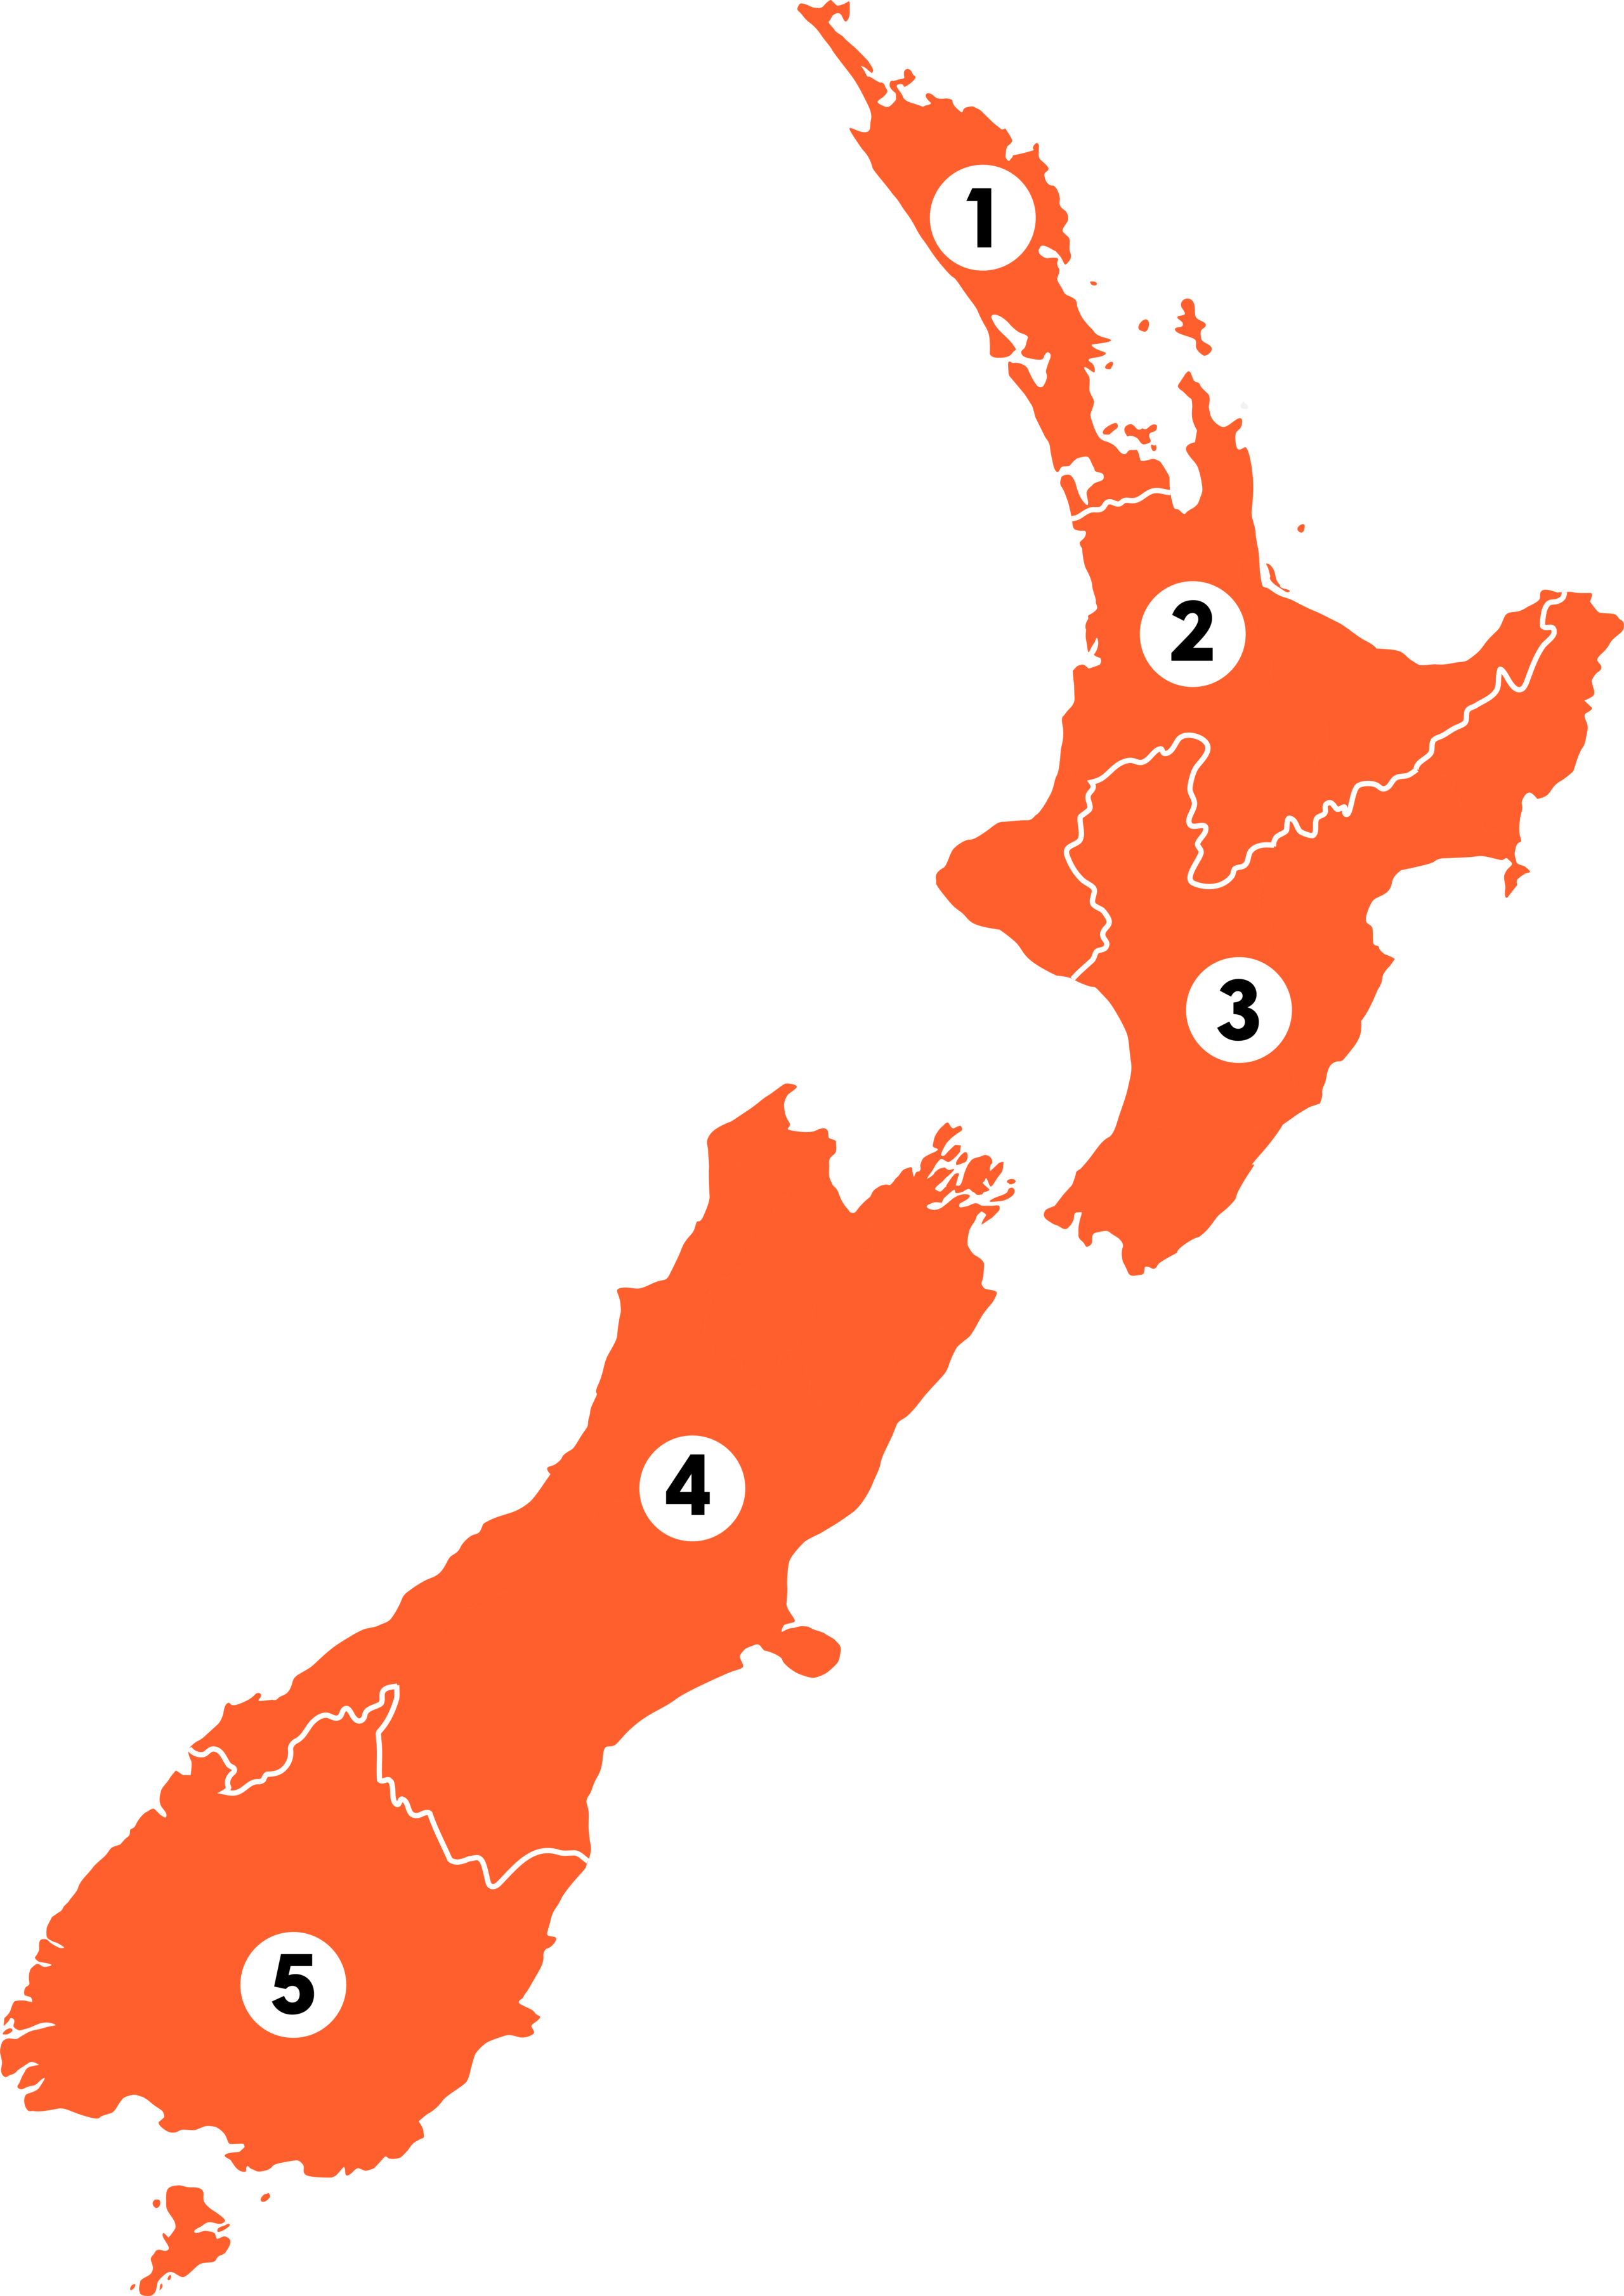
To make national planning simple, oOh! groups the country into five practical territories – a major city with the surrounding towns and regions that share similar demographics and behaviours.
- Northland & Auckland
- Waikato & Bay of Plenty
- Wellington & Central
- Canterbury
- Otago & Southland
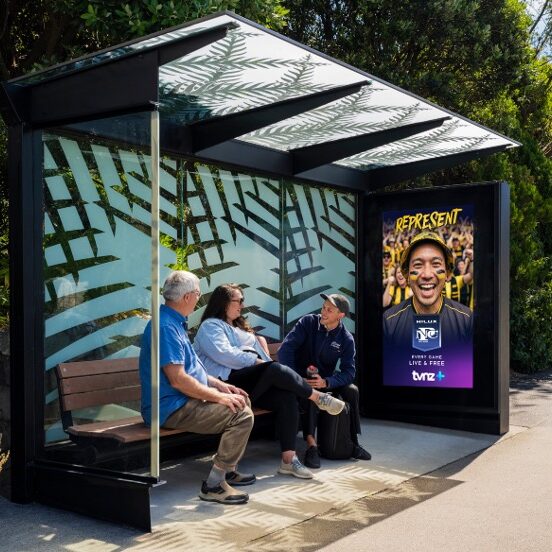
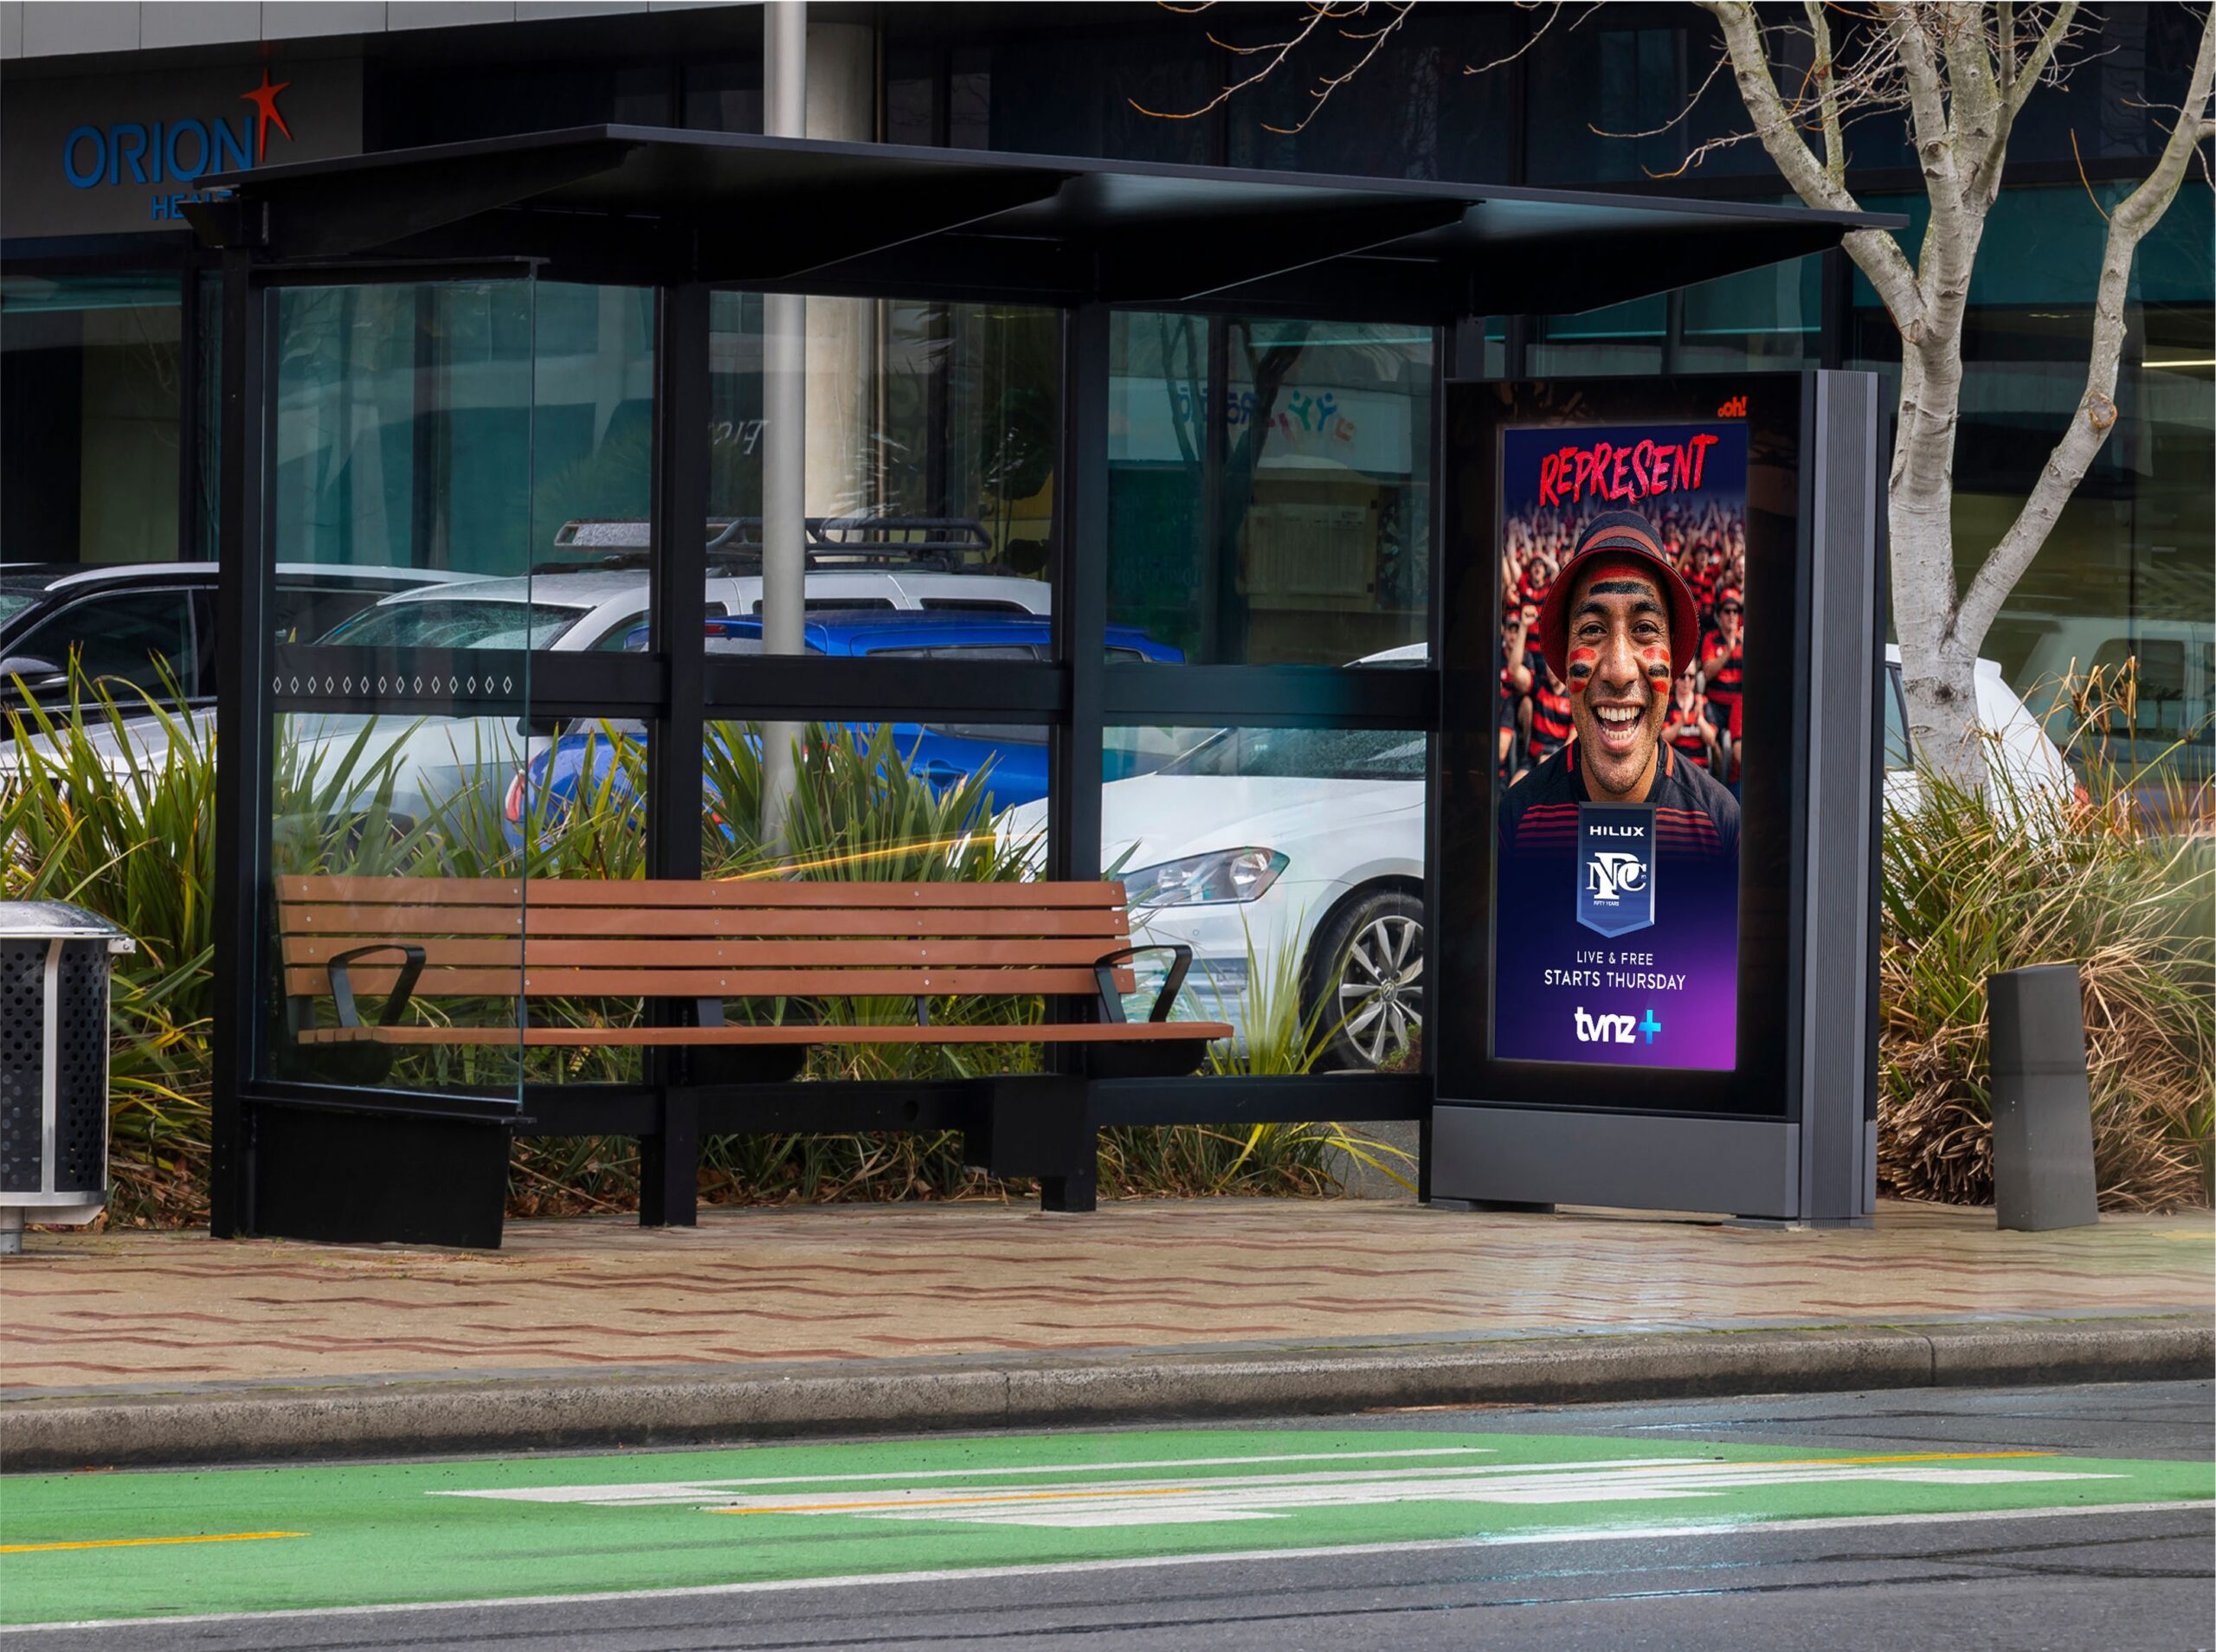
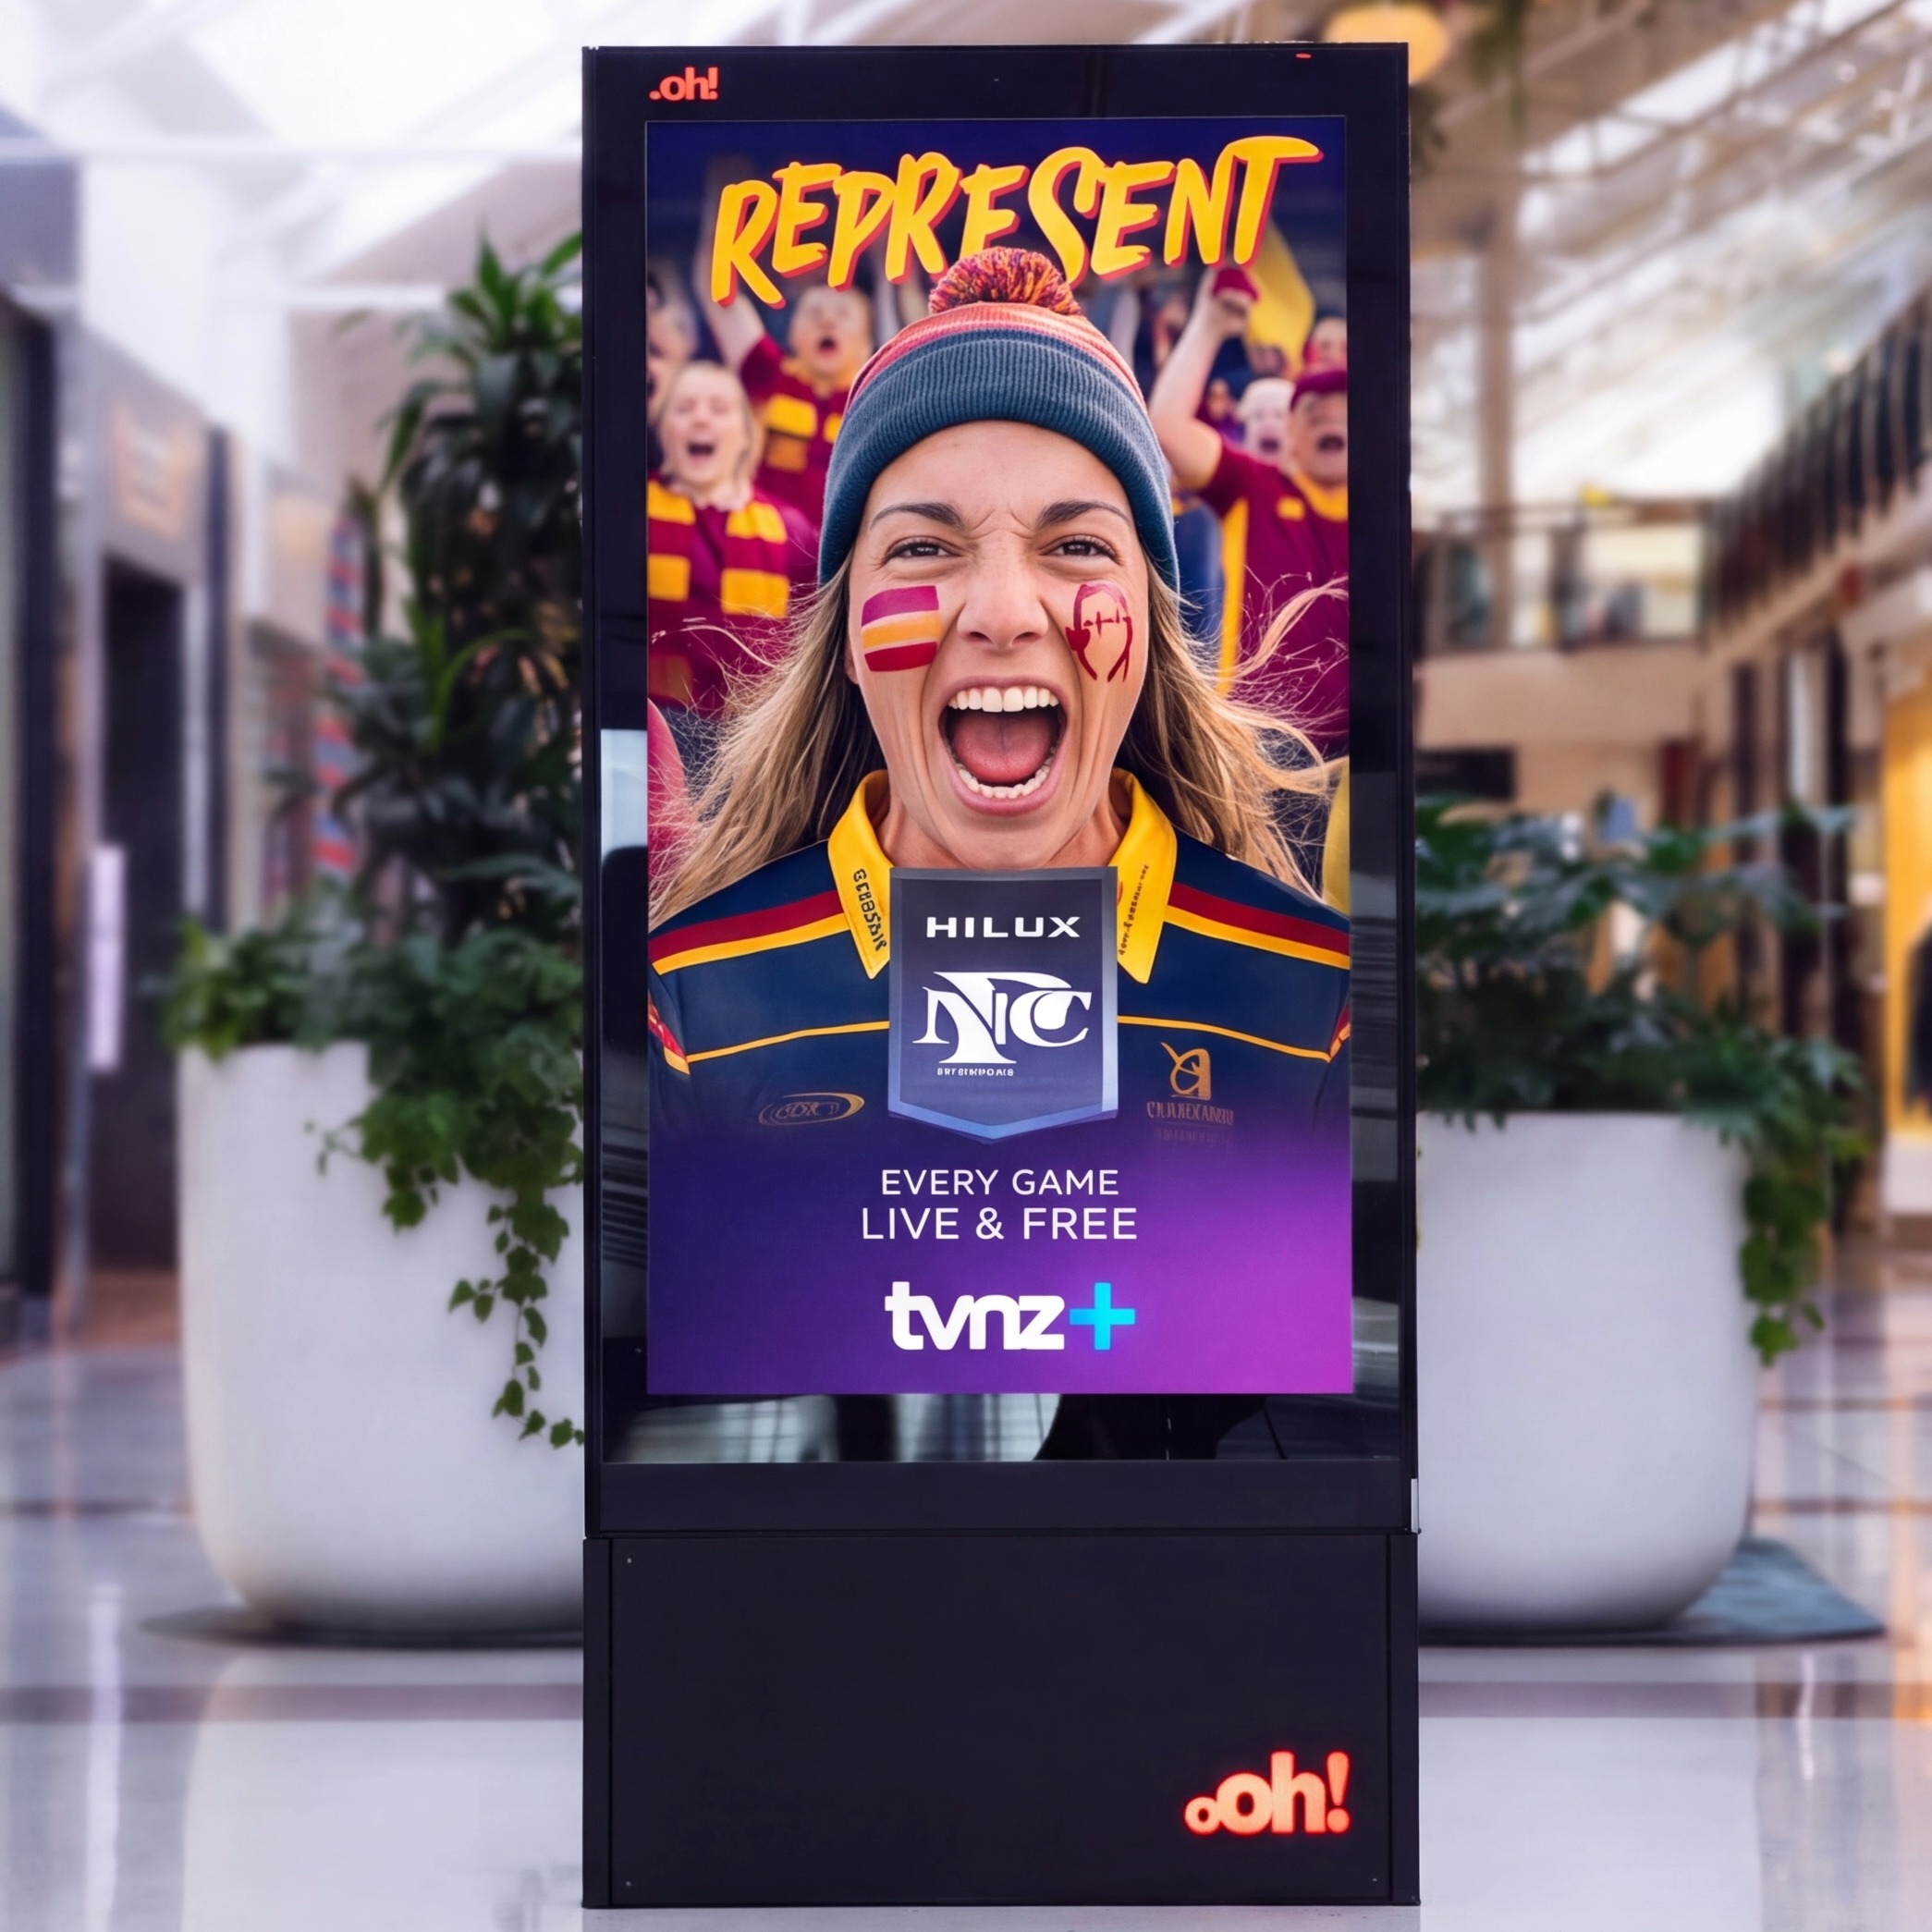
NZ’s Five Territories
- 1. Northland & Auckland
- 2. Waikato & Bay of Plenty
- 3. Wellington & Central
- 4. Canterbury
- 5. Otago & Southland
- Main regions: Auckland & Northland (including Whangārei)
- 37% of the NZ Population
- #1 Highest median house prices
- #1 Highest GDP, $86k per Capita
- 12B Q1 2026 Retail Spend
Source: Stats NZ, ASB Regional Economic Scoreboard Q1 2026
- Main regions: Waikato (including Hamilton and Taupō), Bay of Plenty (including Tauranga), Gisborne and Taranaki (including New Plymouth)
- 20% of the NZ Population
- #2 Highest median house prices
- #5 Highest GDP, 73k per Capita
- 5.6B Q1 2026 Retail Spend
Source: Stats NZ, ASB Regional Economic Scoreboard Q1 2026
- Main regions: Hawke’s Bay (including Napier), Manawatū-Whanganui, Wellington
- 19% of the NZ Population
- #2 Highest GDP, $82k per Capita
- 5B Q1 2026 Retail Spend
Source: Stats NZ, ASB Regional Economic Scoreboard Q1 2026
- Main regions: Canterbury (including Christchurch, Tasman, West Coast, Marlborough
- 17% of the NZ Population
- #3 Highest Median House Prices
- 5.6B Q1 2026 Retail Spend
Source: Stats NZ, ASB Regional Economic Scoreboard Q1 2026
- Main regions: Otago (including Dunedin), Southland (including Invercargill)
- 7% of the NZ Population
- #3 Highest GDP, $82k per Capita
- 1.7B Q1 2026 Retail Spend
Source: Stats NZ, ASB Regional Economic Scoreboard Q1 2026
What actually drives OOH Performance
Research from Analytic Partners shows OOH campaign ROI is driven by: execution and creative.
Four ROI Principles
Maximise Reach through geographic coverage
Campaigns spanning metro and regional markets outperform metro-only buys, cutting through clutter and reaching new consumers.
Prioritise Reach over hyper-targeting
Reach-led campaigns outperform heavily targeted ones – building immediate demand and future brand growth at once.
Invest in effective scale
Above-average OOH investment delivers stronger returns through greater coverage, more formats and longer time in market.
Leverage Retail and creative relevance
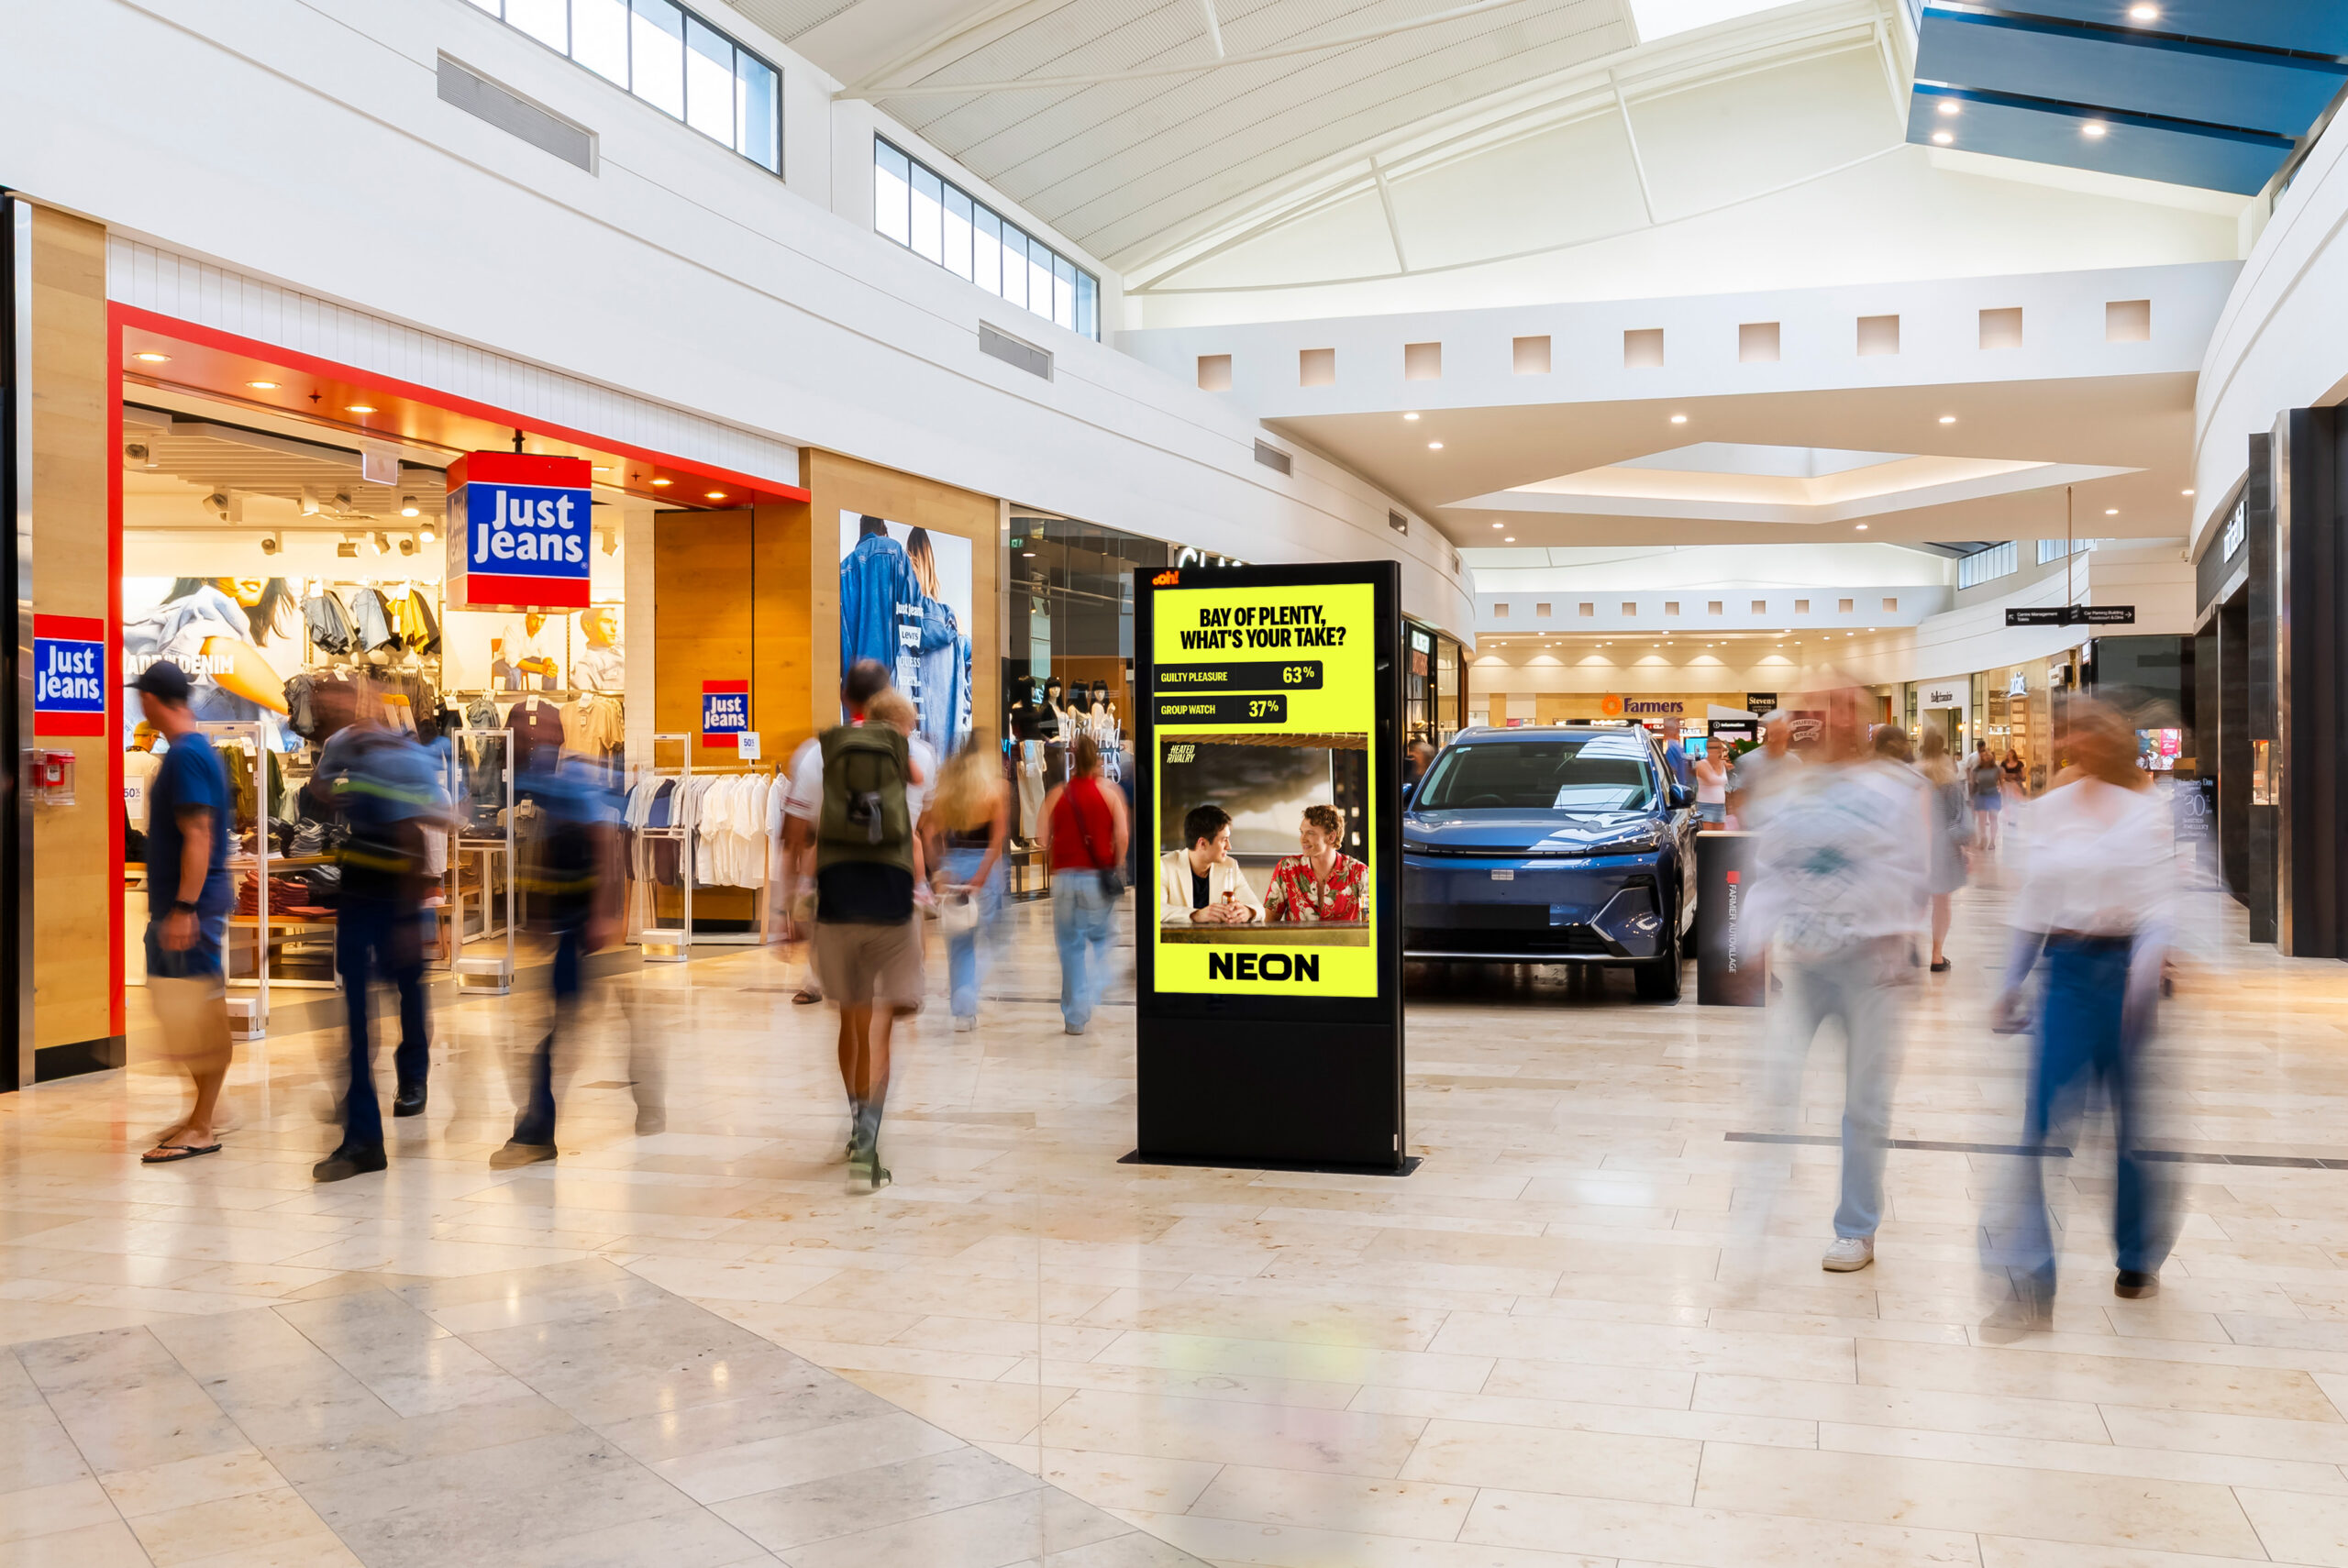
Retail is OOH’s strongest-performing format for ROI, lifted further by contextually relevant creative. 64% ROI uplift is driven by localised creative that speaks to specific audiences and environments.
The oOh! Advantage
NATIONAL SCALE
Delivering audience reach
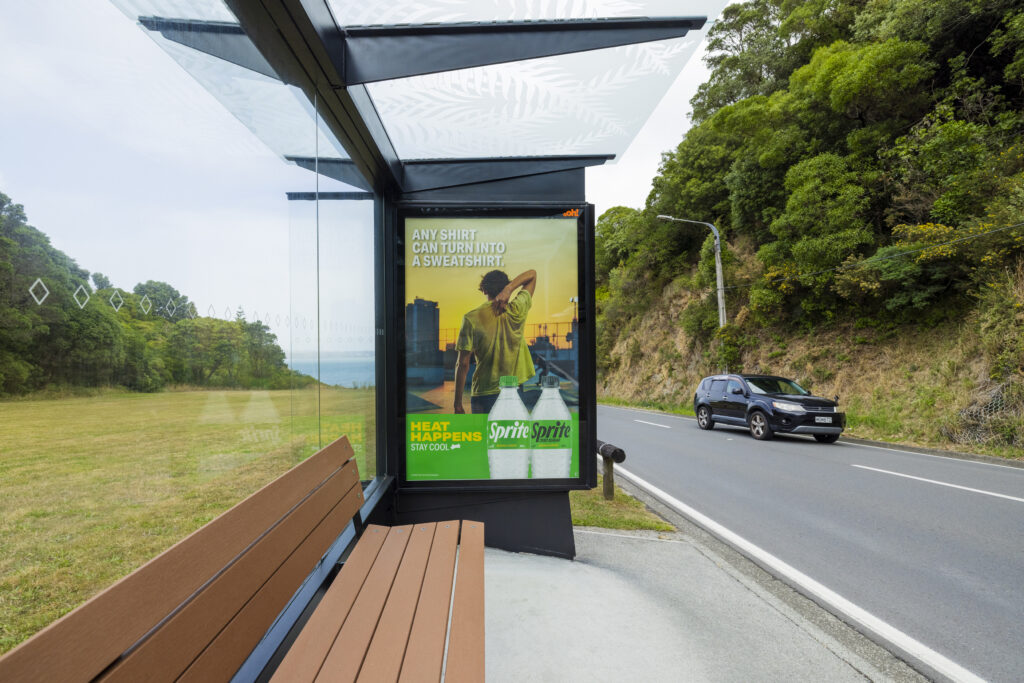
Street Furniture + Retail
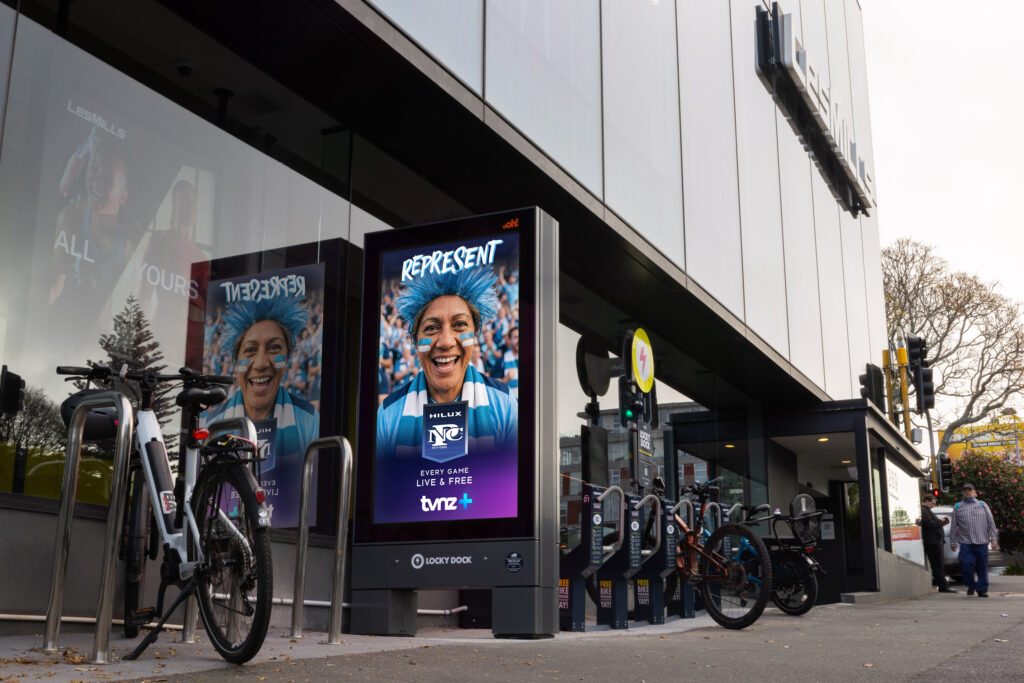
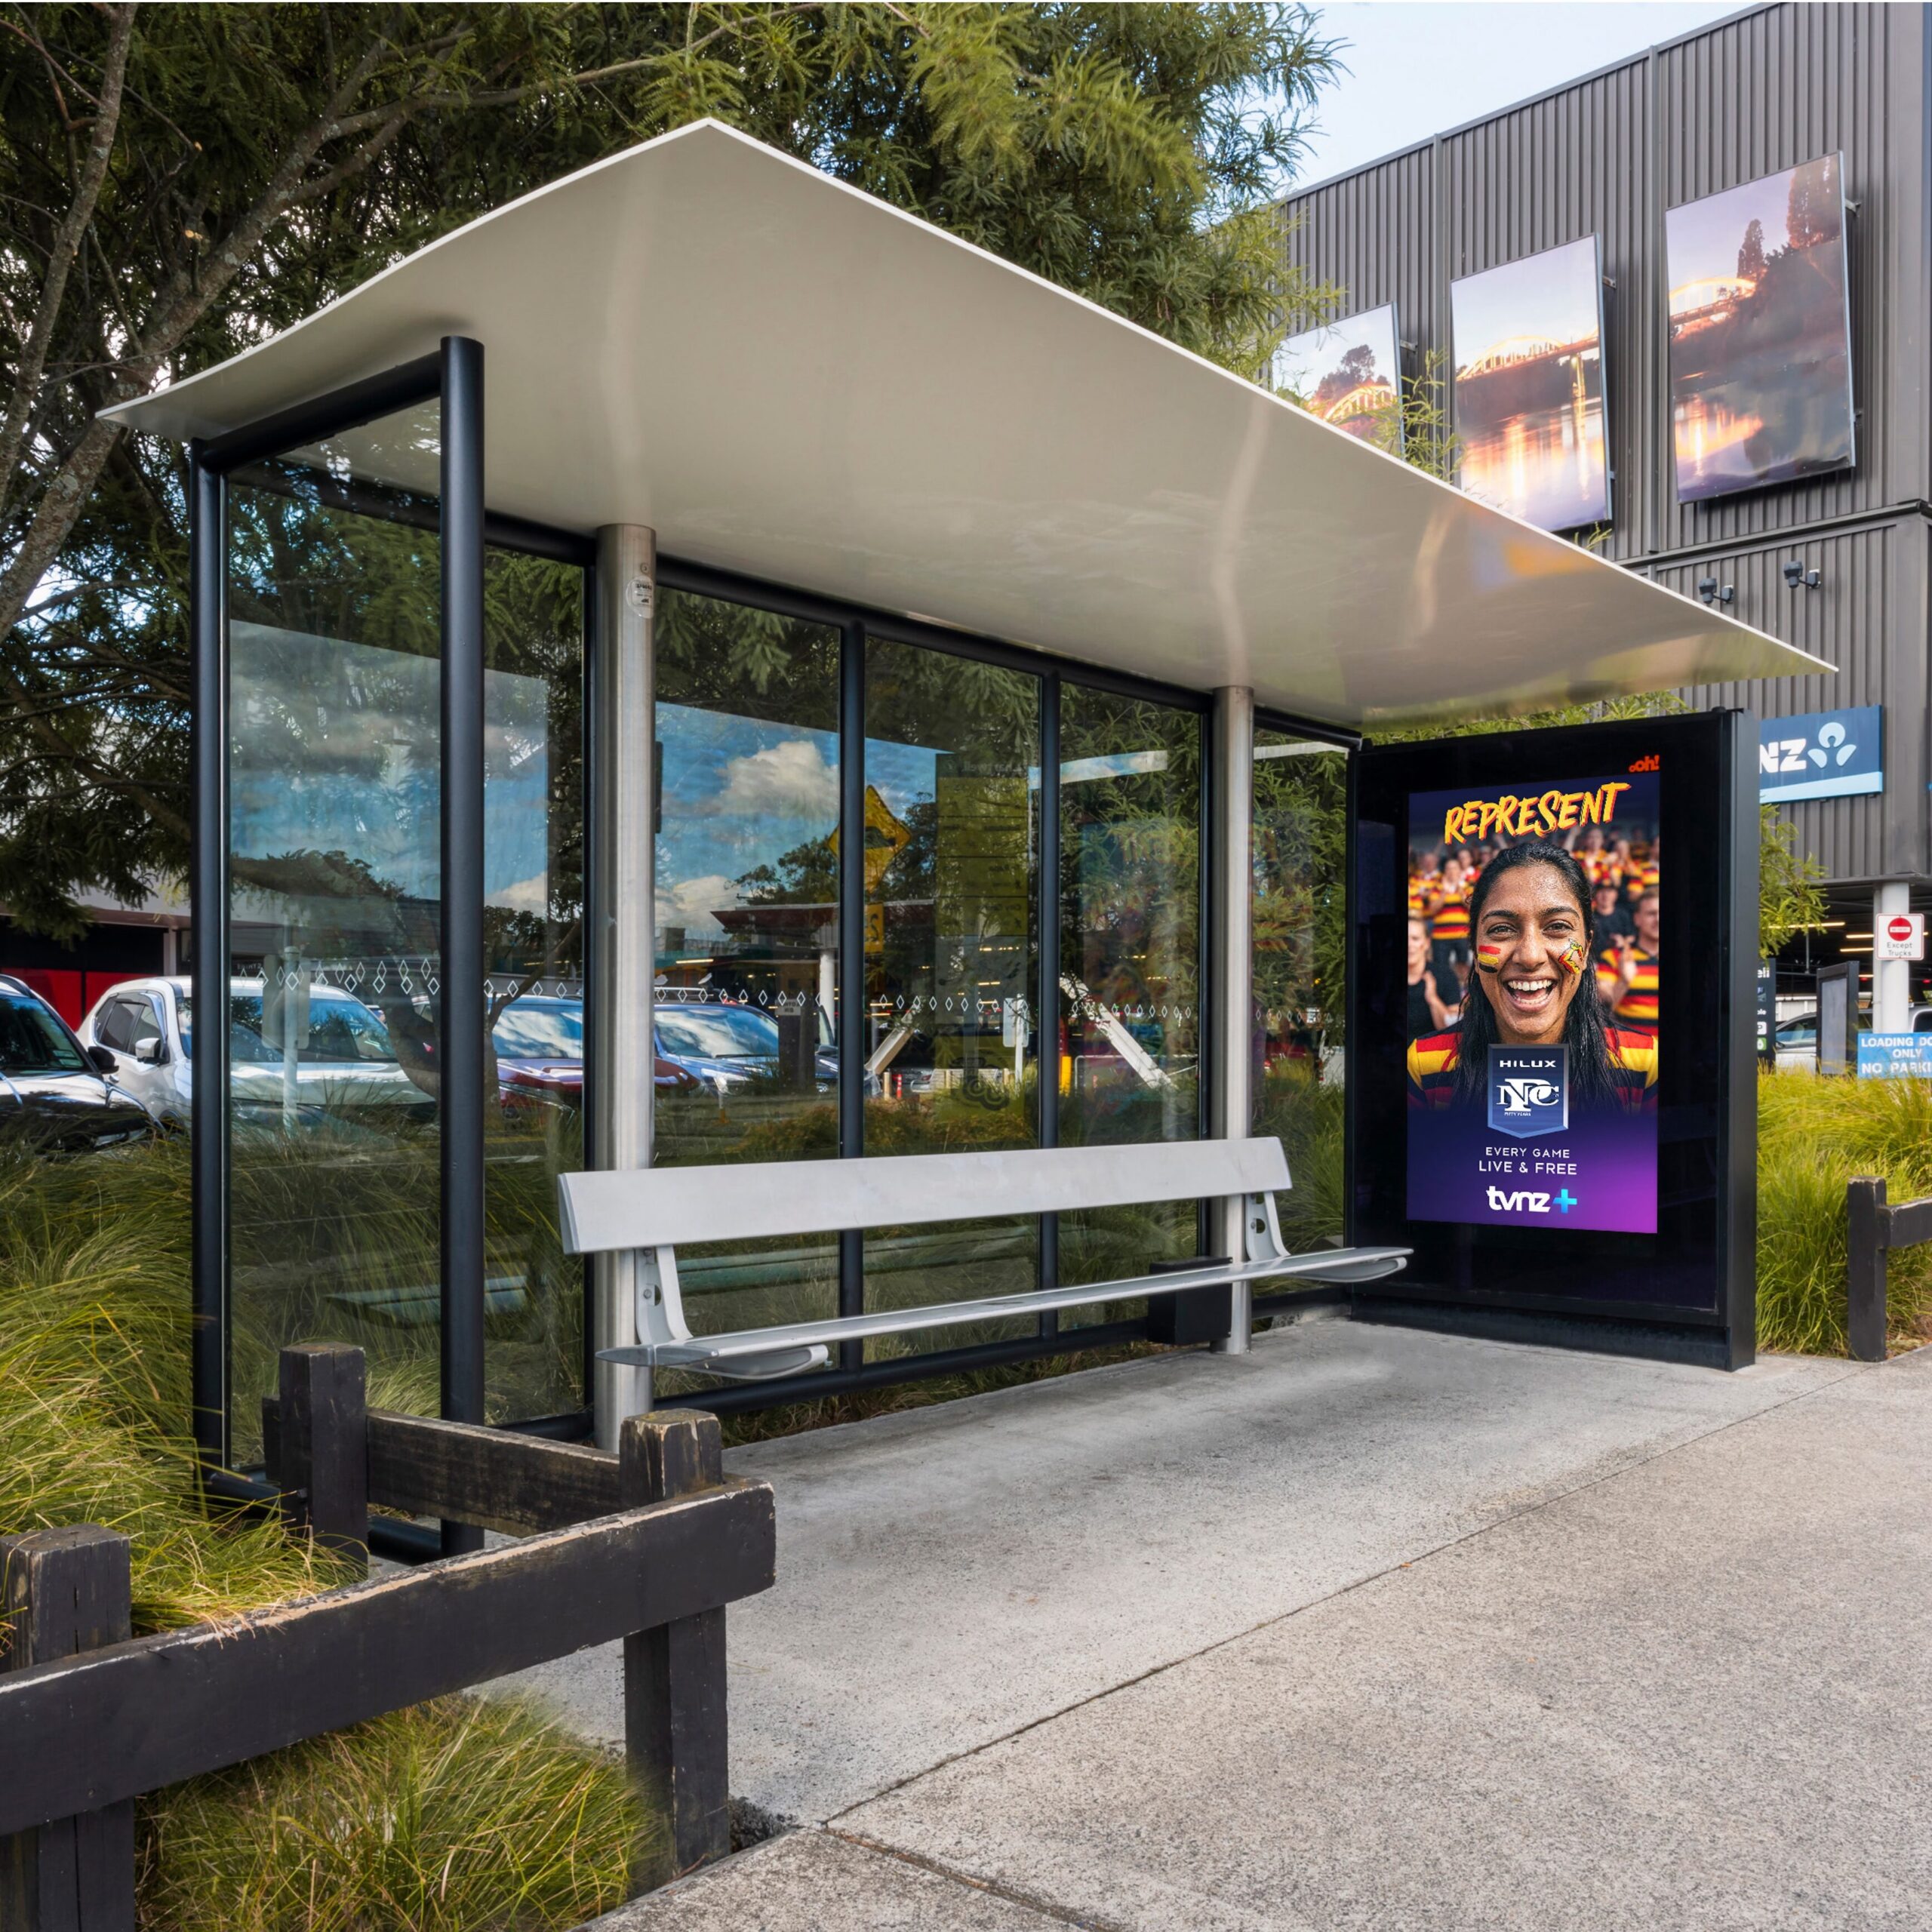
A genuinely national OOH network. Combined, oOh!’s networks create powerful synergies that extend coverage – moving campaigns beyond isolated city buys to reach audiences wherever they live, work, shop and travel.
LOCAL RELEVANCE
Powering audience connection
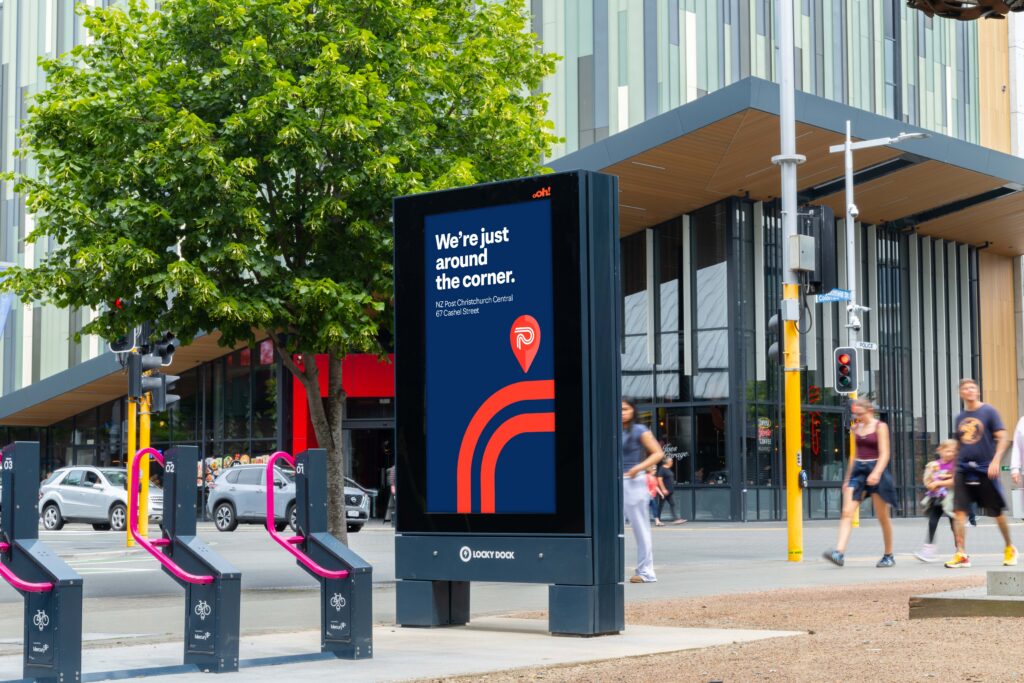
Contextual creative + local environments
Street reaches audiences throughout daily journeys – CBDs, suburbs, regional centres – while Retail reaches people in environments when they’re open, attentive, and ready to convert. Paired with tailored creative, these networks build stronger memory and action.
National Scale delivers audience reach. Local Relevance powers audience connection. Together, they create
The oOh! Advantage.
Data and insights
Best practice, new data, and brand outcomes proving the effectiveness of OOH principles to maximise ROI
Don’t leave ROI on the table
New data challenges old OOH assumptions. Bel Harper shares the latest insights shaping OOH planning.
Case study:
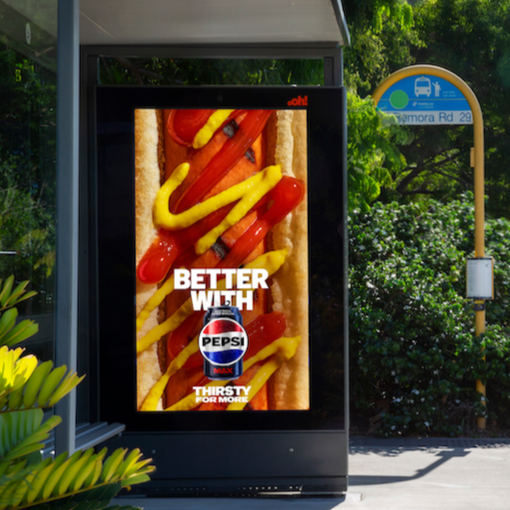
Pepsi Max
+48% increase in consideration.
Growing market share beyond supermarket and convenience stores.
From reach to memory
Why OOH needs a planning reset.
Bel Harper, busts three myths around how to best leverage OOH.
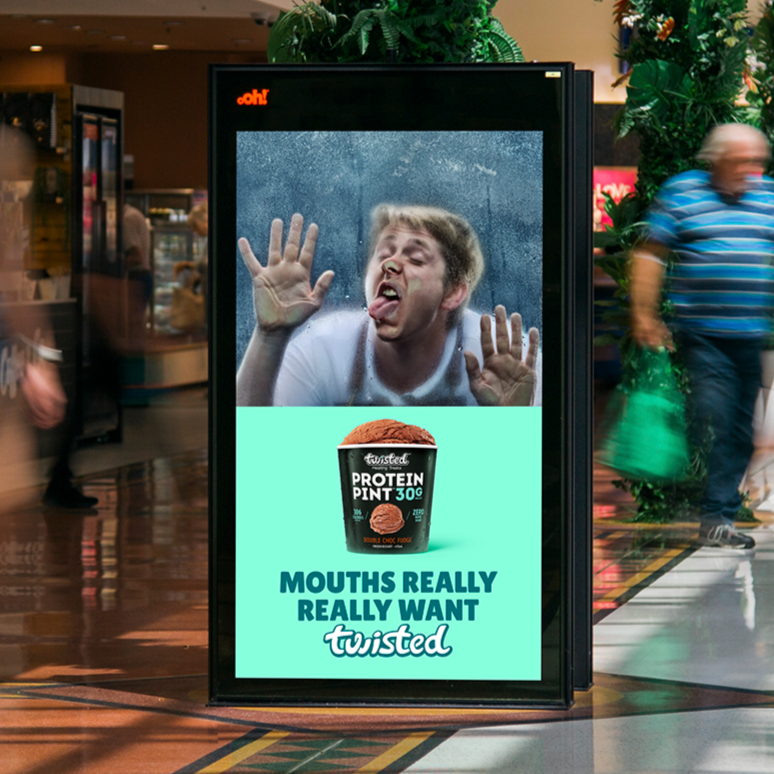
Case study:
Twisted Treats
+ 68% increase in units sold. Accelerating summer sales by driving awareness and consideration.
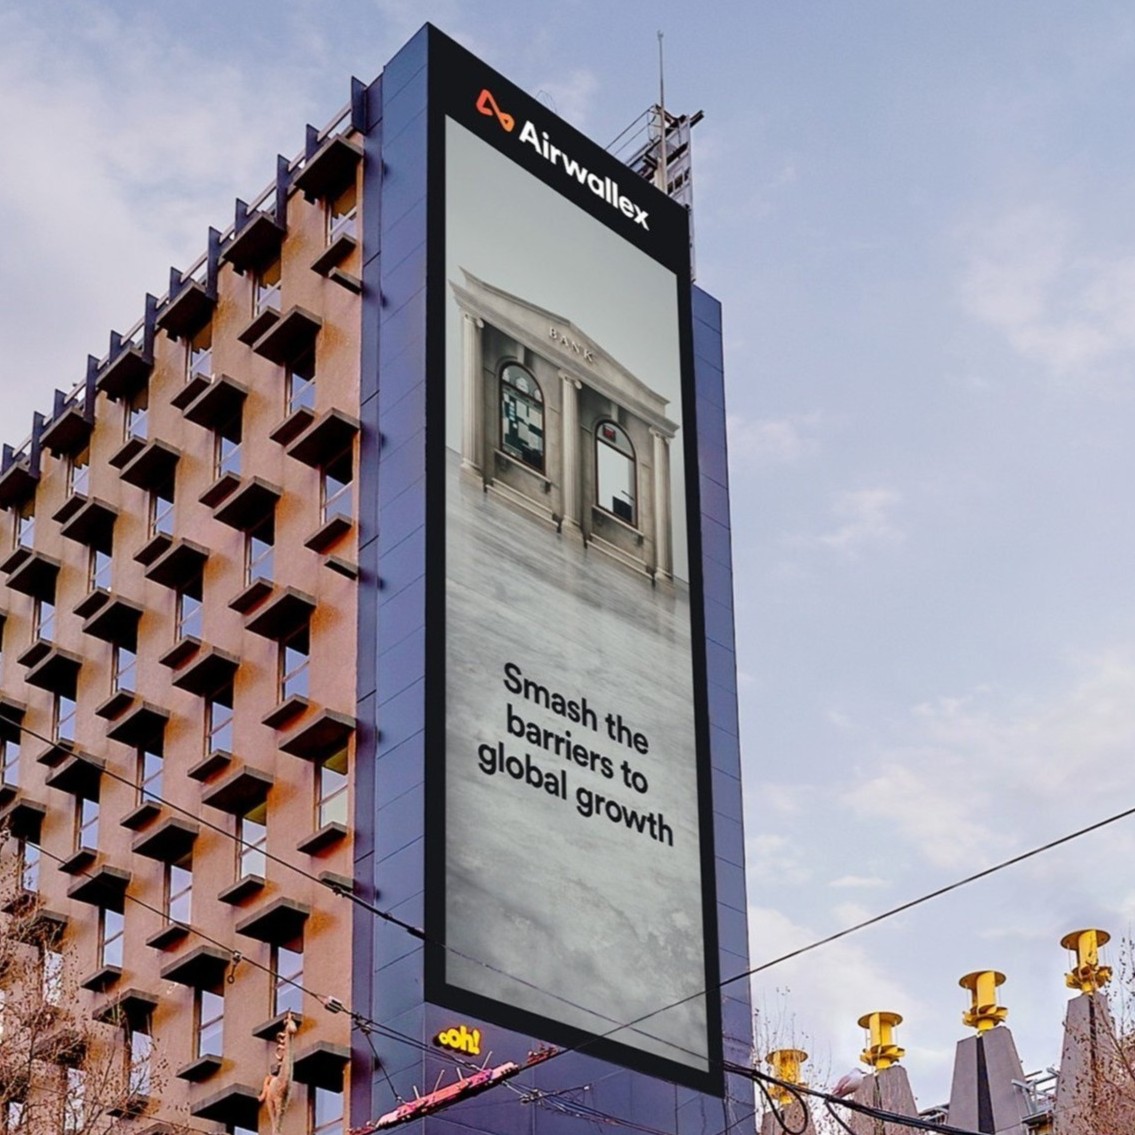
Case study:
Airwallex
+386% increase in awareness.
Cutting through a crowded B2B category with precision.
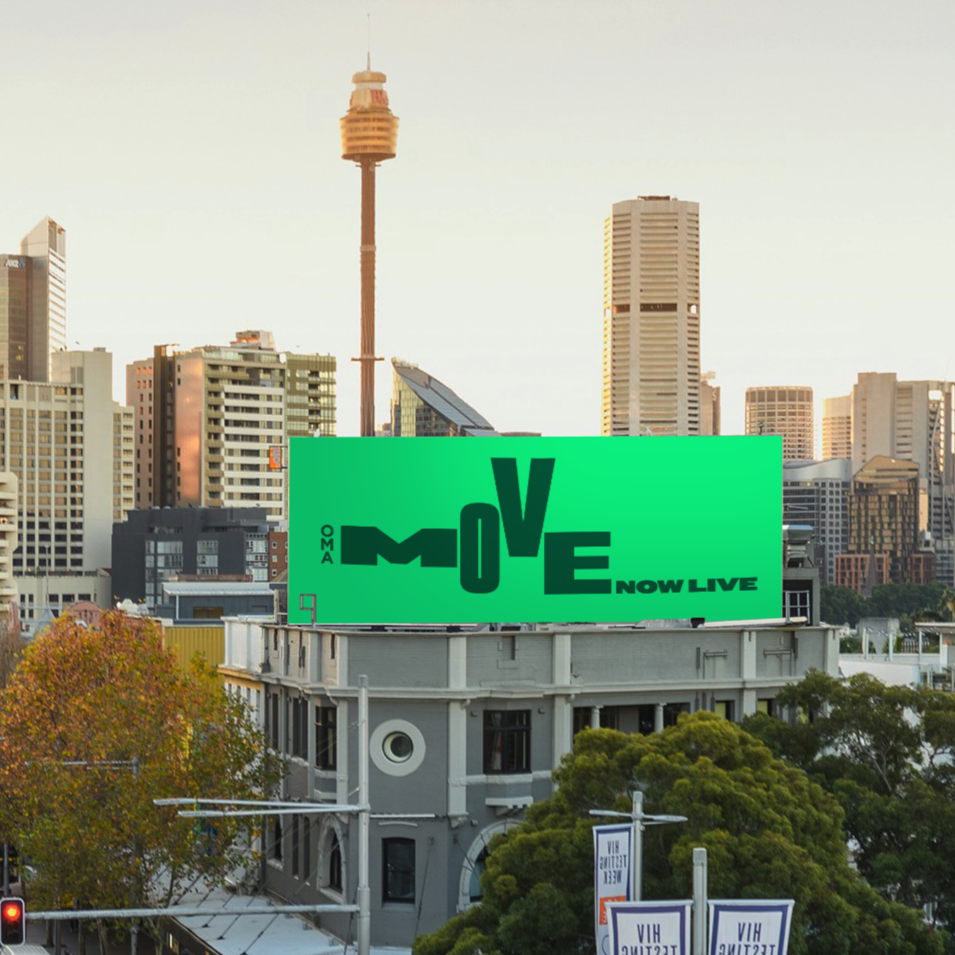
The classic advantage
MOVE data unveils key truths about OOH planning. Mark Fairhurst, Chief Revenue Officer shares insights.